Blog
Understanding Maryland’s Economic Competitiveness: Spotlight on Population & Workforce
Apr 14, 2023
The information provided below is based on data from our 2023 Competitiveness Redbook. Please check back soon for an updated analysis of our 2024 data.
Following up on our recent introduction of our 2023 Competitiveness Redbook for Maryland revealing where Maryland ranks compared to other states in key economic indicators, we’re continuing our series of spotlights on important trends of which to be aware.
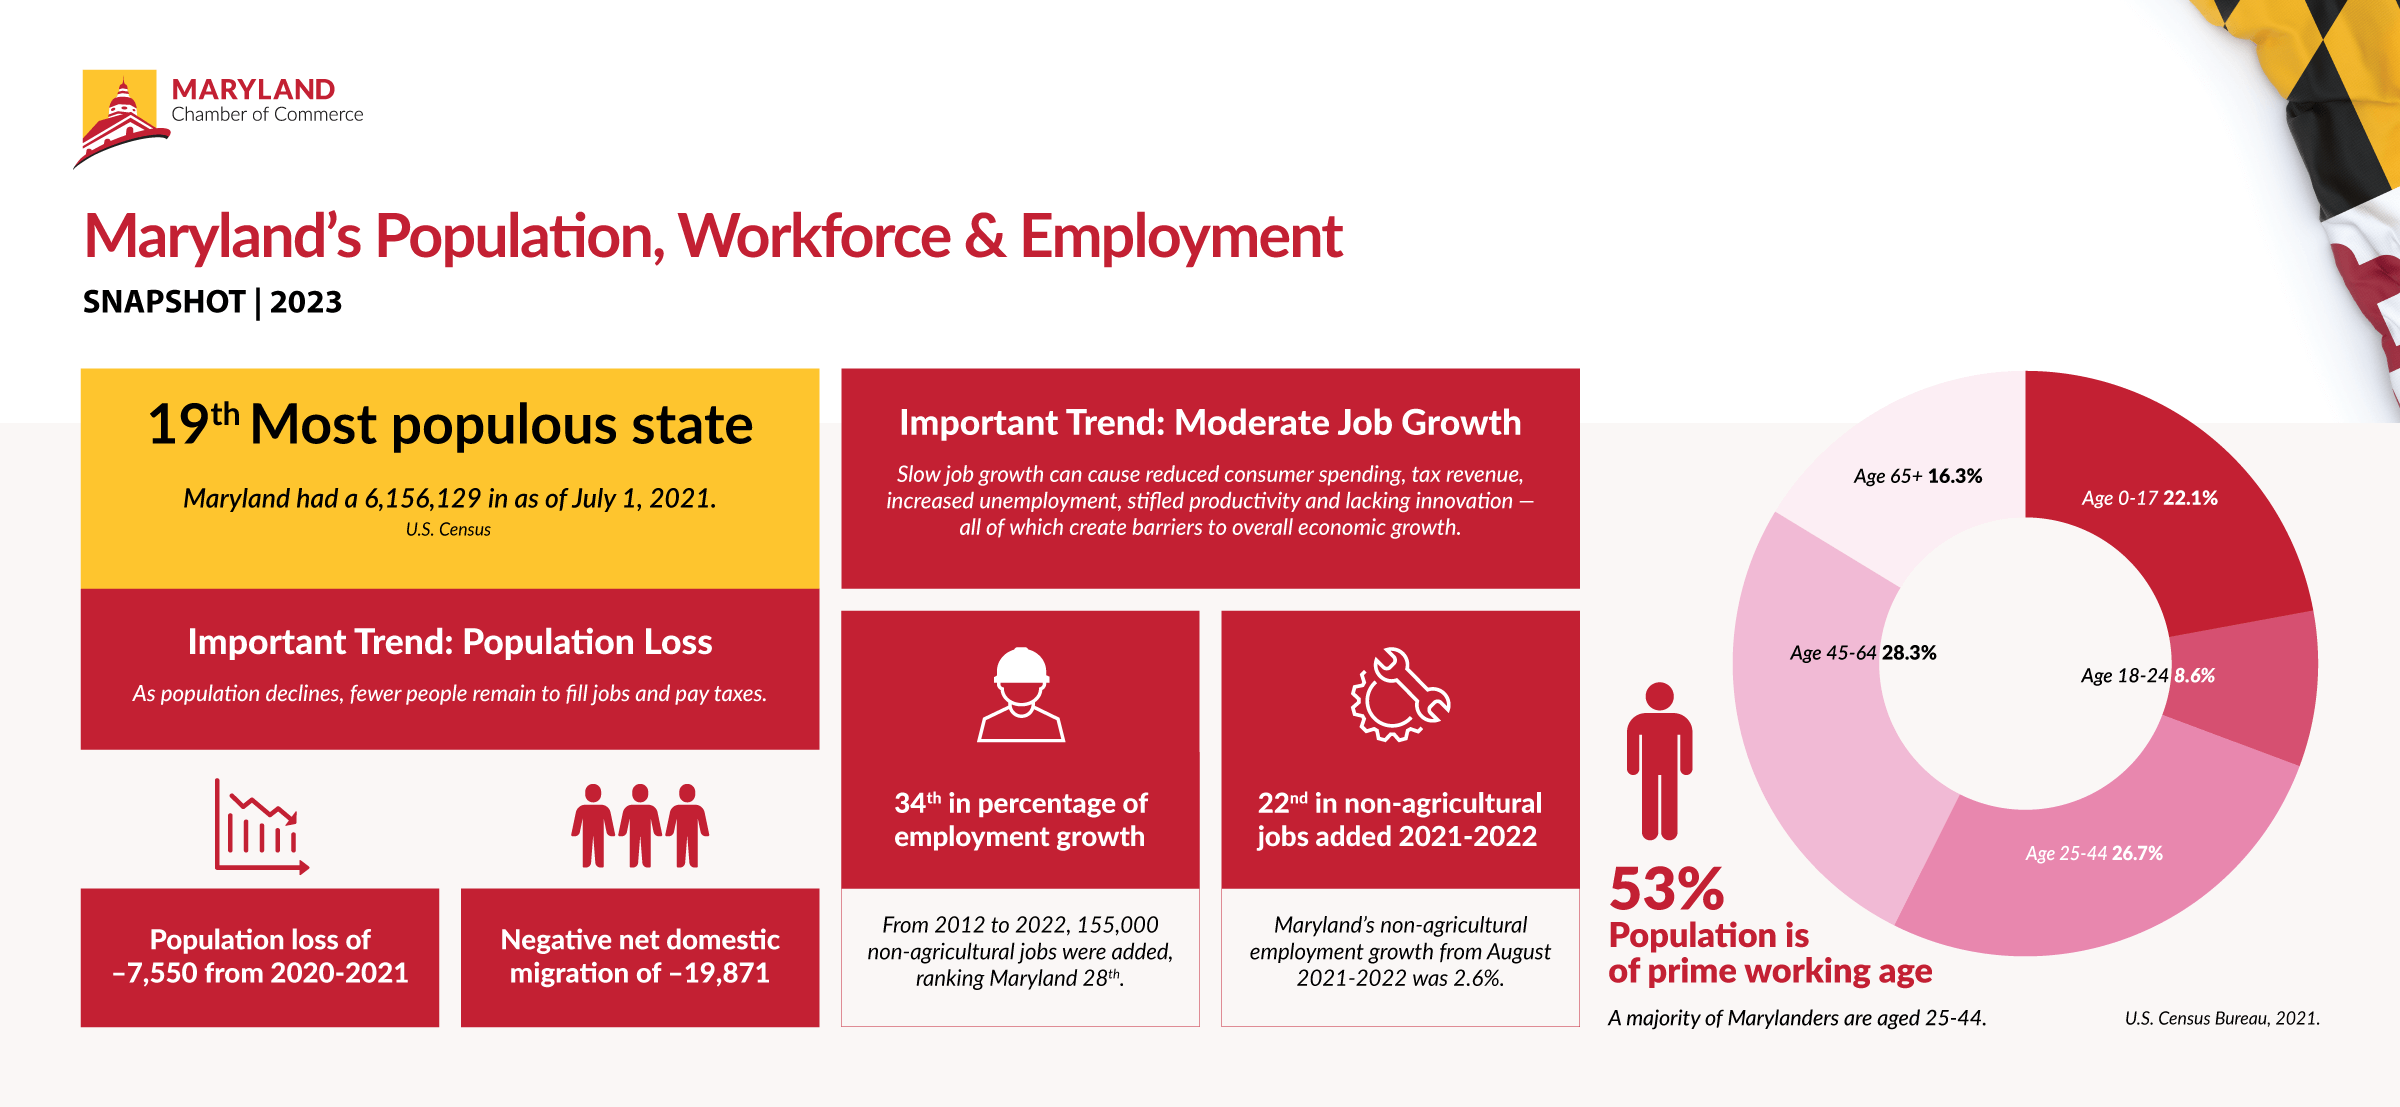
Today we’re focusing on trends regarding population and employment, and what that means for Maryland.As you’ll see, Maryland ranks poorly for total population change, with the state losing 7,550 residents, mostly due to net domestic migration, from 2020 to 2021. In addition, Maryland ranks modestly for employment growth, only gaining 155,000 non-agricultural jobs within the ten-year period of 2012 to 2022. These metrics have negative implications for our economy, including workforce shortages, a declining tax base, a shrinking consumer market and barriers to future economic growth.
To help reverse these trends, we must consider actions and policies that will make it easier for businesses to start and operate in the state, create incentives that help attract businesses to relocate or expand in Maryland, focus on education and workforce development initiatives to provide the skilled workforce that businesses need and invest in infrastructure that helps attract and retain both businesses and residents.
Economic Indicator Spotlight: Maryland’s Population & Employment Trends
Here’s a closer look at what the data reveals and why it matters to Maryland:
Population Trends: Maryland is ranked as the 19th most populous state, but ranks 40th for population growth, with a population loss of -0.12%. Compounding this negative growth, Maryland’s estimated net domestic migration was also negative, ranking the state 44th in this area.
Why it matters: This is concerning for our state’s economy and has implications including a declining tax base, workforce shortages, and a shrinking consumer market, all of which can lead to economic consequences for the state. In addition, as population declines, there are fewer people to pay taxes. This means there is less money to support things like schools, roads, hospitals and infrastructure important to residents and businesses, leading to increases in taxes for the residents and businesses that remain to make up for the lost revenue.
Employment Trends: Maryland gained 68,800 non-agricultural jobs from August 2021 to August 2022, ranking 22nd in the number of jobs gained and 34th in percentage gained. When looking at job growth over the last 10 years, non-agricultural employment growth in Maryland ranks 28th in the nation with only 155,000 jobs added in this period.
Why it matters: Slow job growth is an important trend to watch, as it can cause reduced consumer spending, reduced tax revenue, increased unemployment, reduced productivity, and reduced innovation, which can all create barriers to overall economic growth.
Explore the 2023 Maryland Competitiveness Redbook and our economic indicator spotlights for more information on where Maryland stands — and what it means for our economy, for our state and for business.
We encourage you to use this data to understand the realities facing Maryland’s economy and business community. By working collaboratively to remove obstacles, update policies, and create a pro-business atmosphere where both businesses and communities thrive, we can make Maryland a top competitor for business with an economy that leaves no one behind.
Data Sources:
- State Populations: U.S. Census Bureau, July 1, 2020 to July 1, 2021
- Non-Agricultural Employment Growth: U.S. Bureau of Labor Statistics, August 2021-August 2022 and August 2012-August 2022
Additional Reading:
- Baltimore City and County, other big Maryland jurisdictions lost residents from 2021 to 2022, U.S. census report says (Baltimore Sun, 2023)
- 10 States People Are Fleeing And 10 States People Are Moving To (Forbes, 2023)
- Maryland Occupational & Industry Projections — Workforce Information & Performance (Maryland Department of Labor)
- America’s Labor Shortage: The Most Impacted States (U.S. Chamber of Commerce, 2023)


