Blog
Understanding Maryland’s Economic Competitiveness: Spotlight on Transportation & Infrastructure
Jul 19, 2023
The information provided below is based on data from our 2023 Competitiveness Redbook. Please check back soon for an updated analysis of our 2024 data.
The transportation system serves as the backbone of our economy, facilitating access to jobs, supplies and services for individuals, and enabling businesses to reach more customers while also benefiting from the efficient movement of goods, raw materials and freight.
Insufficient investment in transportation — and inefficient transportation systems — can negatively impact people, economic growth, and businesses, and lead to a state or region being less attractive to residents and businesses.
As you’ll see in the data, Maryland ranks poorly when it comes to state expenditures on roadways, particularly in maintenance spending, while facing some of the highest commute times in the country. These and other key indicators suggest that Maryland better prioritize investment in transportation infrastructure and systems to ensure it can meet our present and future needs.
Economic Indicator Spotlight: Examining Transportation and Infrastructure in Maryland
What the data is telling us:
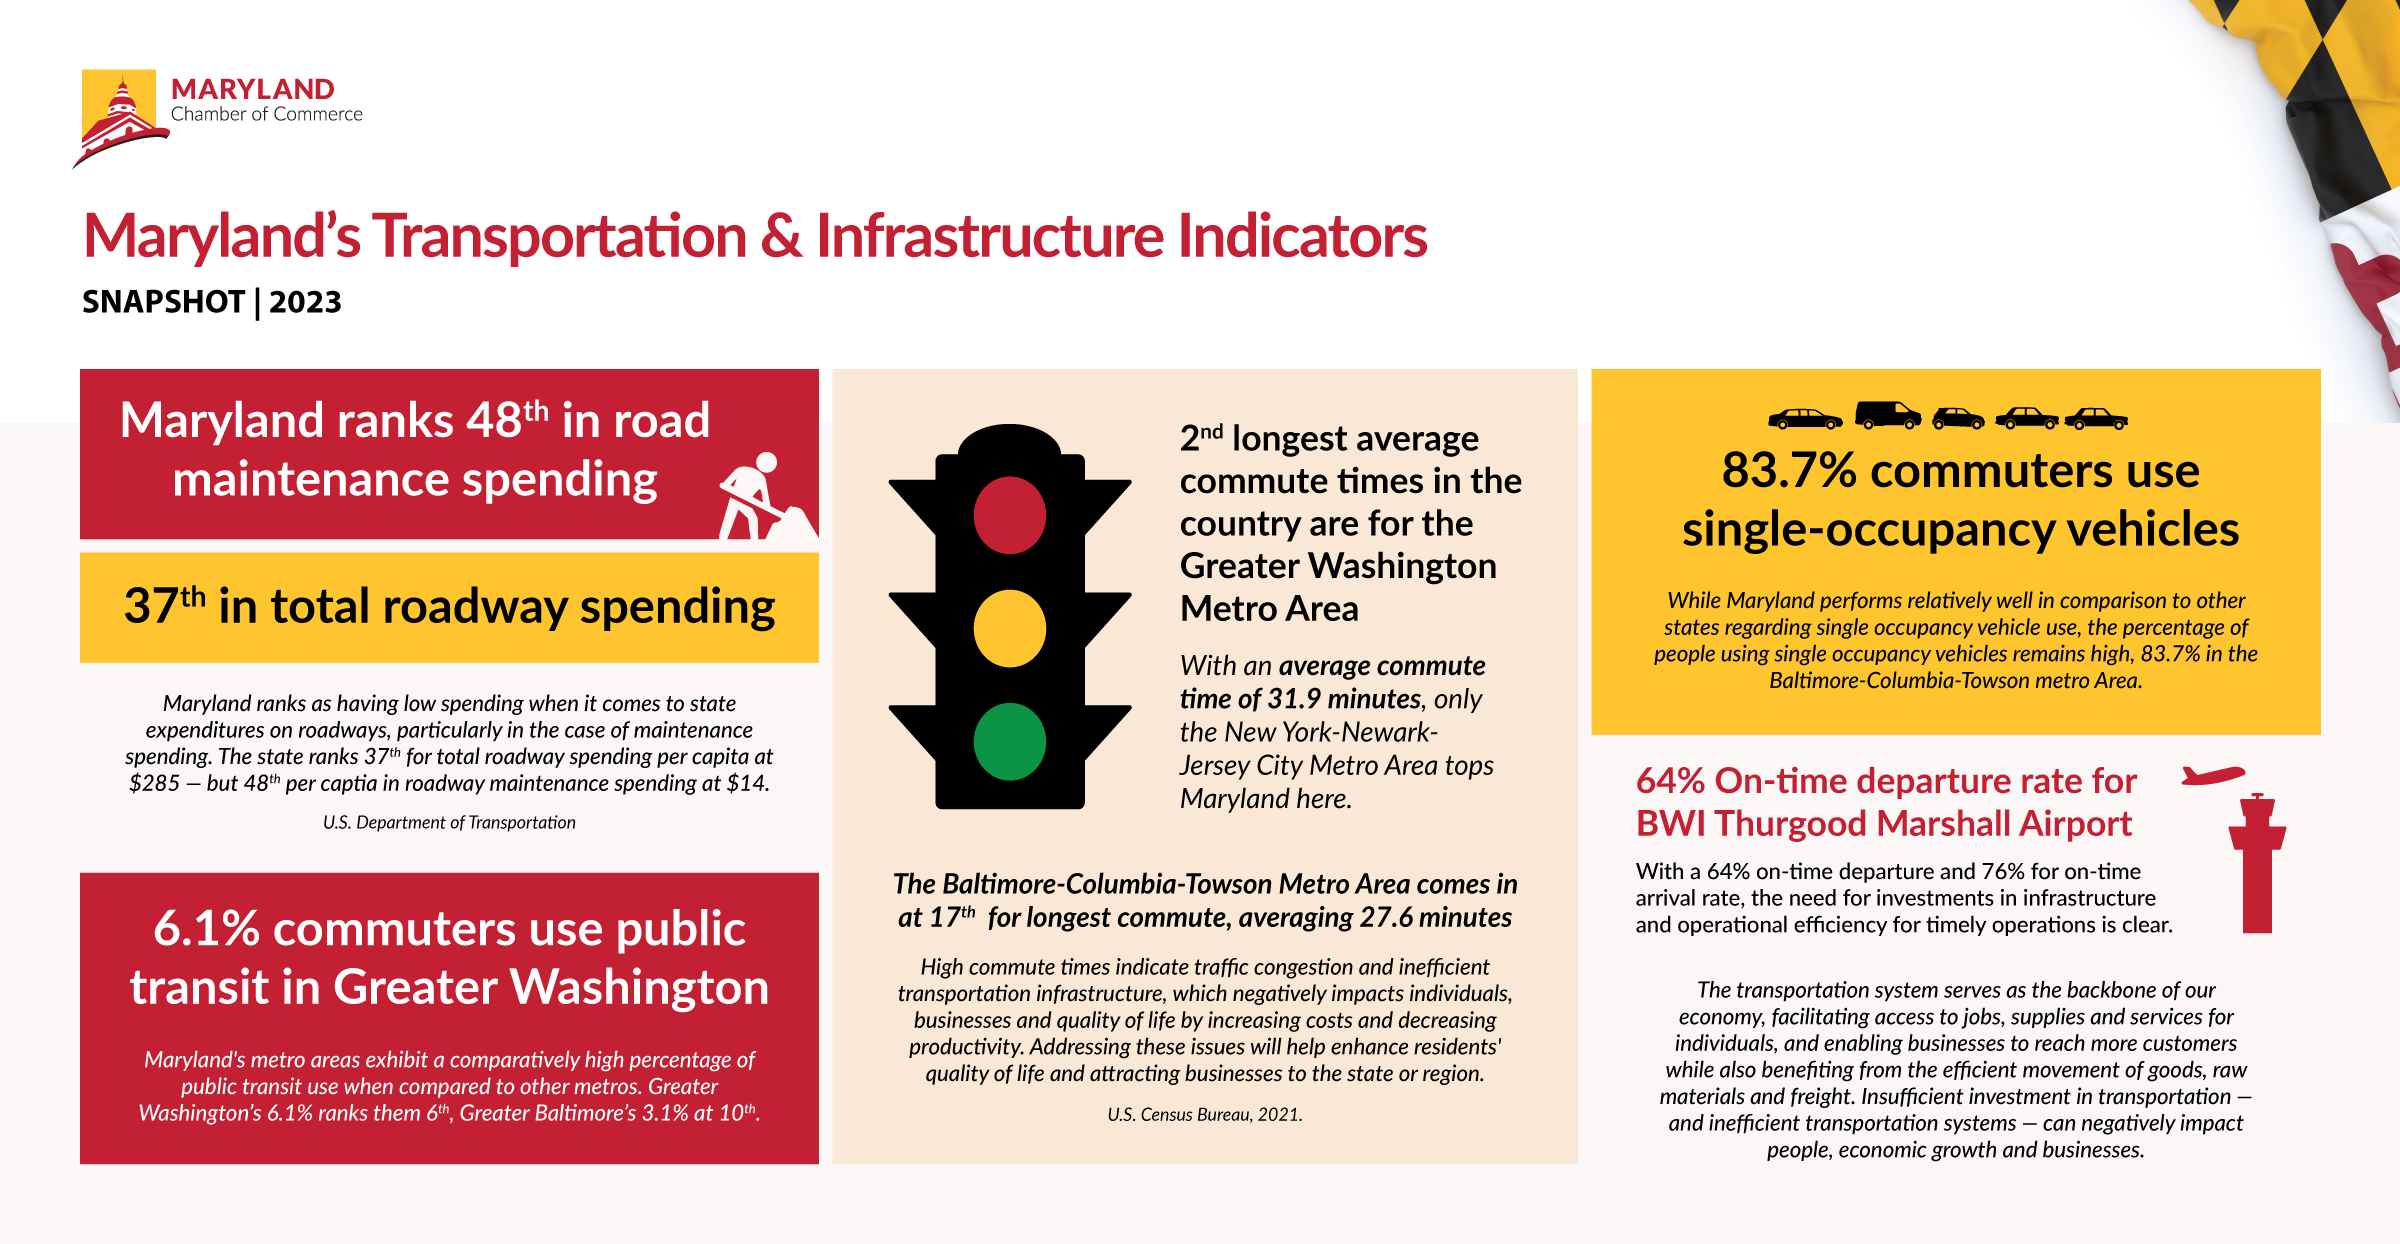
Maryland ranks as having low spending when it comes to state expenditures on roadways, particularly in the case of maintenance spending.
The data: In 2021, Maryland spent $285 per capita in total on roadways. a rank of 37th. That same year, the state allocated $14 per capita for roadway maintenance, ranking 48th (only North Dakota has lower spending). In addition, the American Society of Civil Engineers reports that 48% of Maryland’s roads are in poor condition.
Why it matters: A low state expenditure on roadways, both in total and capital per capita, along with low maintenance per capita, suggests that Maryland is not prioritizing its transportation infrastructure as highly as other states, leading to deteriorating road conditions, increased congestion, reduced safety, increased costs over time, and disadvantages for businesses and economic growth.
Maryland’s metro areas rank as having some of the longest average commute times in the country.
The data: In 2021, the Greater Washington Metro Area had the 2nd longest commute times in the country at an average duration of 31.9 minutes. Only the New York-Newark-Jersey City Metro Area had longer. The Baltimore-Columbia-Towson Metro ranked 17th at an average time of 27.6 minutes.
Why it matters: High commute times indicate traffic congestion and an inefficient transportation infrastructure, which negatively impact individuals, businesses, and quality of life by increasing costs and decreasing productivity. Addressing these issues will help enhance residents’ quality of life and attracting businesses to the state or region.
While Maryland performs relatively well in comparison to other states regarding single occupancy vehicle use, the percentage of people using single occupancy vehicles remains high.
The data: 77.4% of commuters in the Greater Washington Metro Area use a single-occupancy vehicle. That percentage is higher, 83.7%, for the Baltimore-Columbia-Towson Metro Area. These areas rank 47th and 34th, respectively.
Why it matters: The high percentage of single occupancy vehicle use in Maryland may signal limitations with available public transportation and may also be indicative of a dispersed population. Additional investments in transportation infrastructure, improved public transit, and more walkable/bikeable communities may be necessary to help decrease single occupancy vehicle use, traffic congestion and commute times.
Maryland’s metro areas exhibit a comparatively high percentage of public transit use when compared to other metro areas.
The data: 6.1% of commuters in the Greater Washing Metro Area make use of public transit, ranking 6th. 3.1% of Baltimore-Columbia-Towson Metro Area commuters use public transit, ranking 10th.
Why it matters: A high percentage of public transit has positive implications for the state’s economy and business community, such as reduced congestion, lower transportation costs, and improved mobility. However, considering the state’s existing high commute times and other indicators, this data highlights the need for investment in transportation infrastructure, including public transit.
Airport departure and on-time performance suggest investments in infrastructure may be necessary.
The data: Baltimore/Washington International Thurgood Marshall Airport (BWI) ranks lower in departure on-time performance at 64% (28th out of 30) and moderately in arrival on-time performance at 76% (18th out of 30).
Why it matters: These rankings indicate potential operational or capacity issues at the airport, highlighting the need for investments in infrastructure and operational efficiency for timely departures and improvements in operations and capacity for better arrival on-time performance.
Key Takeaways
Insufficient investment in transportation — and inefficient transportation systems — can negatively impact people, economic growth, and businesses, and lead to a state or region being less attractive to residents and businesses.
Maryland’s rankings in transportation spending, commute times, vehicle use and more demonstrate the need for increased investment in transportation infrastructure, systems and maintenance in order to improve quality of life and businesses and economic growth.
Data Sources:
- U.S. Census Bureau, 2021
- U.S. Department of Transportation
- American Society of Civil Engineers
Additional Reading:
- Maryland Infrastructure Report Card (American Society of Civil Engineers)
- Highway congestion could be costing Maryland drivers thousands per year (WTOP, May 2023)
- Keeping Maryland Mobile: Providing a Modern, Sustainable Transportation System in the Old Line State (TRIP, May 2023)
- Transportation Project Portal (Maryland Department of Transportation State Highway Administration)
- Build America Center, Innovative Financing and Delivery of Transportation Infrastructure (University of Maryland)


